SQLIO is a tool available for download from Microsoft that you can use to help determine the I/O capacity of your disk subsystem. Brent Ozar gives a great little video showing you how to use and configure your test batch scripts, as well as how to analyse your results.
There is a section on SQLServerPedia that takes you through “How To Import your SQLIO Results into SQL Server” , the code is available for you to download which creates a couple of tables and a stored procedure which works through your SQLIO results text file to allow you to more easily analyse the results.
When using these scripts I did come across a couple of small issues around decimal places and length calculations which I have amended in the SQLIO_TestPass table creation and made the corresponding changes in the stored procedure to collate the data to report on.
Now that we have briefly gone over what is SQLIO, how you can download it, having created our import tables we are ready to start our testing of SSD’s. As Stated on SQLServerPedia, you need to ensure that your tests are actually getting to the disk and not just staying in cache. This means you are wanting to flush the cache, so your test files need to be larger than your cache. While recently on a client site working on a hardware refresh project which entailed moving onto newly purchased SSD’s. The hardware configuration we are testing here is as follows:
| Samsung 200 GB (SS160520 – CLAR200) Configured in 6 * (4+1) raid groups |
| Presented Volumes are striped across the above configuration |
| EMC CLARiiON CX4-960 |
| SP Read Cache 1000 MB |
| SP Write Cache 8054 MB |
| Qlogic QMH2462 4GB FC |
SQLIO Test 1 Configuration
-
10 GB Test file
-
64 Kb Block size
-
8 Kb Block size
-
4 Threads with 1, 8 & 64 Outstanding IO requests
-
8 Threads with 1, 8 & 64 Outstanding IO requests
-
16 Threads with 1, 8 & 64 Outstanding IO requests
-
32 Threads with 1, 8 & 64 Outstanding IO requests
-
Individual test duration – 180 seconds
-
Random Reads
-
Random Writes
-
Sequential Writes
8 Kb block size test result
Random Reads
Random Writes
Sequential Writes
64 Kb block size test result
Random Reads
Random Writes
Sequential Writes
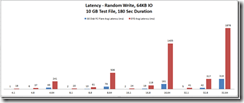
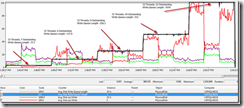
After completing the tests and getting the results as seen in the graphs above, as would normally be expected the Random Read results show the SSD’s outperforms the non SSD’s for both sets of test (8Kb & 64 Kb block sizes). But the Write results were less than impressive. From these first round results the client understandably was concerned. The table below gives the highest values. From these values we try and find the sweet spot for what can be expected.
| Block Size (Kb) | IO Type | IOPS | Throughput MB/sec | Latency (ms) |
| 8 | Random Read | Upwards of 30,000 | Upwards of 250 | 65 |
| 64 | Random Read | Upwards of 12,000 | Upwards of 700 | 196 |
| 8 | Random Write | Upwards of 3,000 | Upwards of 25 | 1046 |
| 64 | Random Write | Upwards of 1,500 | Upwards of 70 | 1878 |
| 8 | Sequential Write | Upwards of 1,600 | Upwards of 12 | 1270 |
| 64 | Sequential Write | Upwards of 280 | Upwards of 20 | 7810 |
SQLIO Test 2 Configuration
With the results received in Test 1, the Random Write was not acceptable. This second round of tests was put together and undertaken to determine the configuration that would provide the appropriate performance.
-
10 GB Test file
-
50 GB Test file
-
100 GB Test file
-
64 Kb Block size
-
32 Threads with 1, 4, 8, 16, 32 & 64 Outstanding IO requests
-
64Threads with 1, 4, 8, 16, 32 & 64 Outstanding IO requests
-
Individual test duration – 180 seconds
-
Random Writes
32 Kb block size test result
Random Writes
64 Kb block size test result
Random Writes
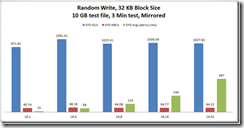
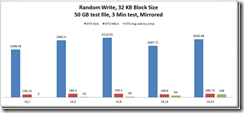
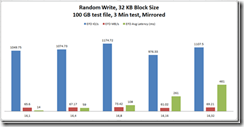
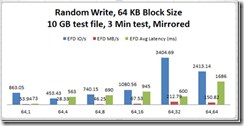
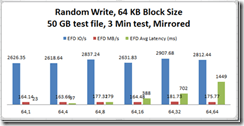
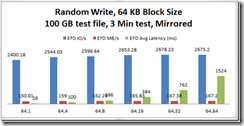
With this second test being solely about random writes the results with the different Threads, Outstanding IO requests against the different file sizes, the results are far better than first time round. With analysing the results it looks like the system should be able to maintain up to 3000 IOPS with around 170 MB/sec throughput.
| File Size (GB) | Block Size (Kb) | Threads | IO Type | IOPS | Throughput MB/sec | Latency (ms) |
| 10 | 32 | 16 | Random Write | Upwards of 1,100 | Upwards of 70 | 497 |
| 32 | 32 | Random Write | Upwards of 1,200 | Upwards of 70 | 902 | |
| 64 | 64 | Random Write | Upwards of 3,400 | Upwards of 212 | 1686 | |
| 50 | 32 | 16 | Random Write | Upwards of 3,100 | Upwards of 195 | 168 |
| 32 | 32 | Random Write | Upwards of 3,000 | Upwards of 187 | 341 | |
| 64 | 64 | Random Write | Upwards of 3,000 | Upwards of 180 | 1449 | |
| 100 | 32 | 16 | Random Write | Upwards of 1,200 | Upwards of 75 | 461 |
| 32 | 32 | Random Write | Upwards of 1,400 | Upwards of 87 | 814 | |
| 64 | 64 | Random Write | Upwards of 2,700 | Upwards of 170 | 1524 |
Conclusion
With the testing that was undertaken to benchmark the new storage architecture, working closely with the storage administrator and in contact with the vendor, the client’s new system should be able to achieve far better performance than the previous kit. After the go live I will be running some benchmarking tests against the old system to give a comparison for the upgrade. If you are considering upgrading your storage, you need to know what you are needing to achieve from the performance so you can get all of the appropriate kit to meet those requirements. Do not be rash in your decisions, but work closely with your vendors to determine the appropriate kit for you. The performance received from the SSD’s is very good but you do pay for that performance. As another option and I am not promoting a product or vendor, but have you heard of FusionIO? This could be a suitable option for you. Brent Ozar has undertaken some testing against this technology and his blog is a good read.
I hope that this has been interesting and an informative read around what you can achieve with your systems and a little bit of testing. All comments are welcome.





Leave a Reply