A new tool became available on the 27th April 2011 and is available for download from Codeplex . This tool makes it simple for you to create the appropriate xml configuration file to use with the SQLDiag tool.
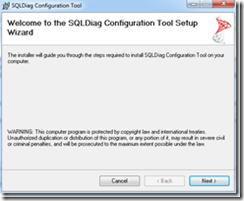
Once you have downloaded the application from Codeplex you are now ready to install this great little tool. From your download directory you can start the install process by double clicking on the setup.msi.
Click Next
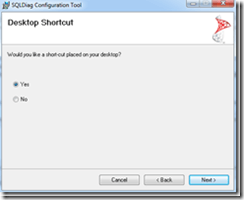
Choose if you want a desktop icon, Click Next
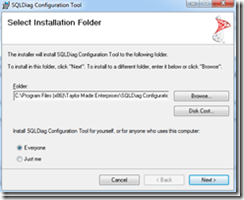
Change your directory that you want the installation placed into. Choose who you want to have access to the application, Click Next
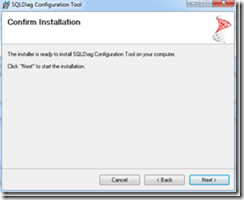
Click Next to finish the installation.
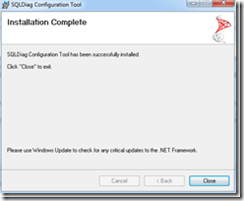
Click Close.
Running the Application
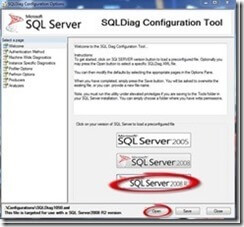
Now that you have completed the installation of the SQLDiag Configuration Tool, you are ready to create your SQLDiag xml Configuration Tool. Starting the application (By Double clicking on the desktop icon) you are greeted with this screen.
You are able to configure xml configuration files for the latest 3 versions of SQL Server
- SQL Server 2005
- SQL Server 2008
- SQL Server 2008 R2
For the purpose of this blog I am only working with SQL Server 2008 R2.
You can either create a new xml file or open an existing configuration file. We are working through the creation of a new file in this blog. Select SQL Server 2008 R2 on the Welcome Tab.
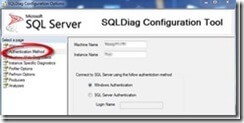
On the Authentication Method tab set the ServerName and Instance Name you wish to connect to and set your connection type (Windows or SQL Server Authentication)
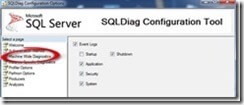
On the Machine Wide Diagnostics tab choose if you want to look at or collect information from the event logs.
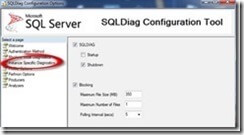
On the Instance Specific Diagnostics tab if you are after some Blocking information, set the appropriate file size based on the space that you have available on disk to save and if you want multiple files and how frequently you want the polling to happen.
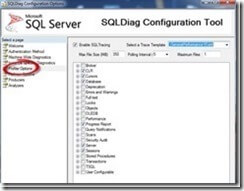
On the Profiler tab you, if you need to run SQL Profiler, you can choose from a couple of different trace templates. You can also configure additional counters you want included in your trace.
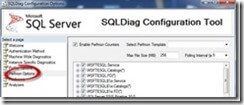
On the Perfmon Options tab you can elect to configure Perfmon trace. The same as the Profiler Tab you are able to select from a number of templates and alter the pre-configured templates for appropriate counters. Remember that the number of counters that you are collecting can have an impact on the server and effect the results you are trying to analyse.
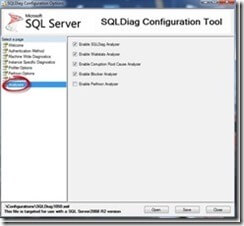
The Analyzer tab by default has the above options. Feel free to change as required.
Click Save
Now that you have created your configuration file you are now ready to run the SQLDiag command line utility using the Argument /I to change the configuration file to point to the newly created configuration file. By default the ouput will be placed into the startup folder of the SQLDiag Tool. Ie “Program Files\Microsoft SQL Server\100\Tools\Bin\SQLDiag” If the SQLDiag folder does not already exist the tool will try and create it.
The SQLDiag command line options are:
sqldiag { [/?] } |
{ [/I configuration_file]
[/O output_folder_path]
[/P support_folder_path]
[/N output_folder_management_option]
[/M machine1 [ machine2 machineN]| @machinelistfile]
[/C file_compression_type]
[/B [+]start_time]
[/E [+]stop_time]
[/A SQLdiag_application_name]
[/T { tcp [ ,port ] | np | lpc | via } ]
[/Q] [/G] [/R] [/U] [/L] [/X] } |
{ [START | STOP | STOP_ABORT] } |
{ [START | STOP | STOP_ABORT] /A SQLdiag_application_name }
For more information on how to use the SQLDiag tool this is available from MSDN – http://msdn.microsoft.com/en-us/library/ms162833.aspx
Enjoy this new tool and I hope it helps you out in your analysis.



Leave a Reply